Revenue per employee: the north star every brokerage should be measured against
The portfolio grows, the team grows too, but revenue per employee falls. This number shows whether growth is happening with leverage or without it. With benchmarks from Germany and the US, worked examples, and an AI-leverage scenario.
By Daniel D.
Modus
Last updated: Jun 3, 2026
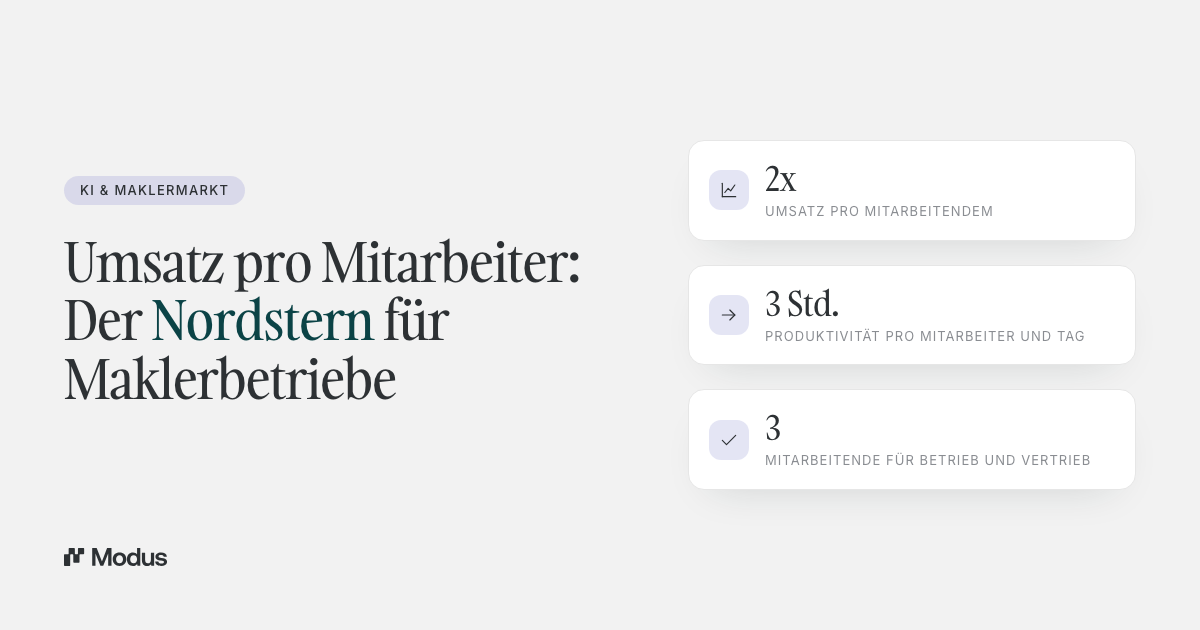
News & Insights150 new portfolio clients in twelve months. Sounds like a good year. Until you run the numbers: two additional case handlers were needed to keep the workflow clean. Annual revenue grows by 9 percent. Personnel costs by 24 percent. Revenue per employee falls by 11 percent.
Growth that isn't profitable. More heads on the team, while operational leverage drops.
A broker who looks only at absolute revenue today is measuring the wrong thing. The number that counts is revenue per employee, calculated on a full-time-equivalent basis. It shows whether your business is genuinely becoming more productive or simply getting bigger. It's the leading indicator of whether growth is moving you closer to, or further from, the exit value you can realistically expect for your portfolio.
This article shows you why revenue per employee is becoming the central KPI in brokerages, how German firms compare internationally, how to work out your own number in ten minutes, and which four operational levers actually move it.
What we mean by FTE: we calculate consistently on a full-time-equivalent basis. A full-time position counts as 1.0, a part-time position as 0.5, temporary staff pro rata by hours worked. Owners count in, provided they are operationally involved. That's cleaner than a simple headcount comparison, which distorts part-time work.
What revenue per employee really measures (and why classic broker metrics fail)
The calculation is a simple division: total revenue for a financial year divided by the number of full-time equivalents that generated that revenue.
The number looks unspectacular. It isn't.
Classic broker metrics fail precisely where revenue per employee brings clarity. Portfolio growth says nothing about whether you're winning additional policies with less or more staffing effort. The EBIT margin is a lagging figure that only becomes visible at year-end, by which point the structural causes are buried. Commission revenue grows even when you buy every additional euro with an additional hour of back-office work.
Revenue per employee is the only broker metric that shows, without any time lag, whether growth is happening with or without leverage. It's diagnosis and early-warning system in one. Anyone familiar with the capacity traps of brokerages will recognise them in the trend line of this single number, before they start to hurt operationally.
The core principle behind it: scale revenue. Not headcount.
The benchmark: where does a well-run brokerage stand?
The comparison problem in Germany is real. There is no central statistic that cleanly reports revenue per employee for brokerages. What does exist are three data layers that together produce a robust picture.
Layer 1: German industry data
The AfW broker survey (November 2023) reports an average revenue for independent intermediaries of 243,000 euros per intermediary. Important caveat: this figure refers to the registered intermediary, not to the full-time equivalent of a larger firm. Since, according to the BVK structural analysis, 51.4 percent of brokers work in one- or two-person structures, the figure is heavily shaped by sole-operator data. Average profit comes in at 79,000 euros. The follow-up analysis shows a wide spread: 50 percent of intermediaries earn under 55,000 euros in profit, and only 25 percent clear 100,000 euros. The BVK structural analysis 2025 adds that the average brokerage has 4.4 employees.
For a 5-FTE brokerage with one registered intermediary supported by four case handlers, revenue per employee comes out correspondingly lower than the 243,000-euro headline figure. Realistically, mid-sized brokerages (3 to 10 FTE) today sit between 120,000 and 200,000 euros in revenue per employee. Individual, ambitiously run firms exceed 250,000 euros; others get stuck at 80,000 to 100,000 euros, which structurally points to a lack of leverage.
Layer 2: international best practices
The IIABA Best Practices Study 2025 measures revenue per employee of 228,321 US dollars among the top 25 percent of US brokerage agencies. Elite agencies leading in several best-practice categories reach over 300,000 US dollars. According to Kentley Insights 2025, the industry average across all US brokerages is 295,688 US dollars per employee.
The figures can't be transferred one to one. US brokerages have different commission structures, higher average premiums, and more heavily consolidated markets. What does transfer is the spread between the median and best practice: in the US it's around 1.3 to 1.5 times. In Germany it's wider in absolute terms. That means the gap between an averagely run and an ambitiously run German brokerage is larger than most owners assume.
Layer 3: the AI lever as a realistic shift
What raises revenue per employee without doubling the portfolio or massively building up the team? The answer is currently shifting.
Studies of German brokerages suggest that 60 to 80 percent of working time goes into administration, not into advice or sales. A firm that reclaims 20 to 30 percent of its operational time has two options: shrink the team at the same capacity, or serve a larger portfolio with the same team. Both routes structurally raise revenue per employee.
Worked example: a brokerage with five full-time equivalents serves 800 portfolio clients and generates 1.0 million euros in revenue. Revenue per employee today: 200,000 euros.
If the firm deploys an operational infrastructure that automatically turns incoming emails, documents and WhatsApp enquiries into structured cases with an owner and priority, then, conservatively estimated, two hours per employee per day are freed up. That's 25 percent of capacity.
The same team then serves 1,000 clients instead of 800 over time. At the same margin structure, revenue grows to 1.25 million euros, while headcount stays at five FTE. Revenue per employee: 250,000 euros. A shift of 50,000 euros per position, without a single hire.
This lever isn't hypothetical. Among Modus users it is measurable that address changes, which classically take 10 to 25 minutes, are reduced to 1 to 2 minutes. For a mid-sized brokerage with 200 address changes a year, that corresponds to freeing up 30 to 75 hours, for this one process type alone.
Conversion 0.93 EUR/USD, mid-market rate May 2026.
The strategic reading: a German brokerage that today achieves between 150,000 and 200,000 euros in revenue per employee is in the industry-standard range. One that reaches 250,000 to 300,000 euros has deployed operational leverage. One that exceeds 350,000 euros is operating in a league that is still structurally sparsely occupied in Germany. That's exactly where revenue per employee becomes a differentiator.
| Benchmark | Revenue per employee | Source |
|---|---|---|
| Realistic range for German brokerages, 3-10 FTE | €120,000-200,000 | Market observation |
| IIABA Best Practices (top 25 percent) | ~€212,000 | IIABA 2025 |
| AfW Vermittlerbarometer (per adviser, not per FTE) | ~€243,000 | AfW 2023 |
| AI-native brokerage (worked example) | €250,000+ | Modus projection |
| US insurance brokerages (average) | ~€275,000 | Kentley Insights 2025 |
| IIABA Elite Agencies | €280,000+ | IIABA 2025 |
How to calculate your own number: in ten minutes
The calculation itself is trivial. It's the cleanliness of the input data that decides the outcome.
What counts as revenue
Include portfolio commission, new-business commission and service fees. In pool cooperations, count the share that actually stays in your business, not the gross revenue before pool settlement. Anyone who overstates here flatters their own number and makes the comparison with benchmarks worthless.
What counts as FTE
An FTE is a full-time position with 38 to 40 hours a week, depending on the collective agreement. Part-time staff count as 0.5. Temporary staff pro rata by hours actually worked. Owners count in if they are involved in day-to-day operations. Consulting contracts with external parties count only if the activity produces productive output, not if it reduces the volume of service tasks.
Worked example 1: the 3-person firm
Owner in sales (1.0 FTE), one full-time client manager (1.0 FTE), one full-time case handler (1.0 FTE). Annual revenue 900,000 euros.
Revenue per employee = 900,000 ÷ 3 = 300,000 euros.
That's a very solid number, comparable to the upper US benchmark. The firm is highly efficient. The question back: how does it scale from here to 5 FTE without destroying the number?
Worked example 2: the 11-person firm
Owner in sales (1.0), two client managers (2.0), five case handlers (5.0), one part-time back-office worker (0.5), two apprentices (1.5 effective). Total: 10 FTE. Annual revenue 2.2 million euros.
Revenue per employee = 2,200,000 ÷ 10 = 220,000 euros.
That's not bad, but it's below the first example. The scaling effect was bought with back-office build-up. The next section shows where the leverage potential lies.
Trend line, not snapshot
A single number says little. The 24-month trend line says everything. Is your revenue per employee rising? Stagnating? Falling despite portfolio growth? That trajectory is the real diagnostic instrument. Pull the number together monthly or quarterly, alongside portfolio growth and personnel costs, into a single overview.
Personnel costs: the other half of the equation
Revenue per employee without the context of personnel costs is a half-truth. The German pay landscape sharpens the pressure.
According to gehalt.de, an in-house insurance clerk earns an average of 40,491 euros gross per year, with top figures around 52,660 euros. Insurance brokers in the narrower sense, according to teilzeit.net, come in at an average of 65,544 euros, within a range of 47,832 to 83,256 euros.
On top of that: the 2025 insurance collective agreement provides for an increase of 2.68 percent for 2025 and a further 4.02 percent for 2026. An owner who is bound by the collective agreement or takes their cue from it faces a cost rise of a good 6.7 percent in the total wage bill over 24 months. Without a corresponding rise in revenue per employee, the margin melts away.
The rule of 3
A proven heuristic: revenue per employee should be at least three times the full personnel cost per FTE. Full cost means gross salary plus employer contributions plus a pro-rata share of overhead (workstation, IT, training, insurance). For a case handler on 45,000 euros gross, the full cost is around 60,000 euros. Three times that would be 180,000 euros in revenue per employee as break-even on margin. 200,000 is healthy. 250,000 is scalable.
This number isn't a rigid truth but a diagnostic heuristic. It works well for brokerages with a normal portfolio structure. For specialised firms with a high-value portfolio (for example commercial property with high premiums), the necessary margin sits differently.
The four operational levers that move revenue per employee
Anyone who wants to raise revenue per employee structurally has four practical adjusting screws. Each is legitimate on its own; in combination they work multiplicatively.
Lever 1: portfolio mix
Not every policy generates the same revenue for the same workload. Private health portfolios generate higher per-policy commission at a service volume comparable to property. Commercial portfolios weigh more heavily than private motor. A firm that knows its own portfolio structure and steers it deliberately raises revenue per employee structurally.
Lever 2: automating case handling
Estimates from German brokerages suggest that 15 to 25 percent of case-handling time goes into standardisable processes: address changes, simple claims notifications, document filing, premium adjustments, follow-ups. Classic broker management programs automate a fraction of that. An operational infrastructure that turns incoming emails, WhatsApp messages, documents and calendar entries into structured cases with an owner, priority and traceability shifts this lever substantially. Concretely: an address change that classically takes 10 to 25 minutes can be reduced to 1 to 2 minutes. At 200 address changes a year, that's 30 to 75 freed-up employee hours.
This is exactly the layer Modus is built to deliver: not as an extra tool alongside the management program, but as an operational layer over existing systems.
Lever 3: specialisation
Vertical specialisation (for example medical professions, self-employed IT workers, trades and crafts, care providers) produces higher conversion rates, fewer queries per case and stronger cross-selling effects. Generalists struggle with more complexity per case at the same commission rate. A 5-FTE firm that achieves clear verticalisation can, after three years, realise revenue per employee that is 30 to 50 percent higher than a generalist of the same size.
Lever 4: self-service journeys
Small clients with standard requests (address change, policy retrieval, claims notification with a clear-cut set of facts) can be served via a client app and automated journeys, without a case handler manually taking up the case. The employee share per small-client case drops, and attention shifts to high-margin portfolio clients and new business. The strategic consequence for portfolio structure: a firm that serves the bottom 20 percent of its portfolio via self-service journeys gains between 8 and 12 percent operational capacity, without cancelling a single policy.
How the levers interact
The four levers aren't mutually exclusive choices; they build on one another. Automation and self-service deliver the biggest effect in the short term, because they take effect immediately. Specialisation works in the medium to long term, because it requires repositioning. Shifting the portfolio mix is the slowest adjusting screw, but the most structurally sustainable. A firm that addresses all four levers in parallel over twelve months, rather than working through them serially, experience shows achieves 1.5 to 2 times the effect of a pure single-lever program. More on the strategic logic of this shift in the article "Why the next generation of brokers doesn't grow through employees".
What revenue per employee means for your exit value
Portfolio sale is the most common exit form for brokerages. The reality is sobering. An analysis by the Resultate Institut shows that in over 50 percent of portfolio sales the multiple achieved is below 2.0. Only one in five sales reaches a multiple above 2.5. At the same time, according to procontra-online.de, only 10 to 20 percent of brokers assess the value of their own portfolio realistically.
Why this spread? Buyers in 2026 no longer buy just a portfolio. They buy the business that manages the portfolio. Efficiency becomes visible in due diligence: per-capita revenue, cancellation rate, documentation depth, process maturity. Three intermediaries who together turn over 750,000 euros are often more valuable today than six who together turn over 900,000 euros. The lower dependence on personnel reduces the risk for the buyer and raises the multiple.
The case for revenue per employee as a steering metric isn't operational but strategic: it's the only number that, in the long run, predicts both operational profitability and exit value. Anyone wanting to understand this connection structurally will find the larger context in which revenue per employee becomes the guiding metric in the article "How AI is changing the business model of the insurance broker".
Your 90-day roadmap to your own north-star number
The following three steps are scoped so that they can be implemented without consultant support and without a system overhaul.
Weeks 1 to 2: work out the number and build the trend line
Calculate revenue per employee for the last 24 months, in 6-month steps or monthly, depending on data availability. Enter portfolio growth and personnel costs alongside it. You'll see immediately whether the three figures grow proportionally (linear mode) or whether one rises disproportionately (leverage).
Weeks 3 to 6: identify the top 3 levers
Audit your firm along the four levers. Which one delivers the biggest contribution in 12 months in your specific case? For most firms of our size, the portfolio-mix lever comes last, because it takes several years. Automation and specialisation take effect faster.
Weeks 7 to 12: first lever experiment
Choose one lever, define a measurable change (for example: 30 percent of address changes automated, 20 percent less case-handling time per claim, 15 percent more cross-selling in a specialised target group), and establish a reporting rhythm. Revenue per employee becomes a KPI discussed monthly in the team meeting, not a year-end trivia point.
Frequently asked questions
What is a good revenue per employee for a brokerage?
In the German market, the industry average for 3-to-10-FTE firms is around 150,000 to 200,000 euros per full-time equivalent. Figures above 250,000 euros count as above-average, and above 300,000 euros as best-practice level in international comparison. What matters isn't the absolute value but the 24-month trend line.
How does revenue per employee differ from revenue per head?
At their core, both measure the same thing. Revenue per employee is calculated consistently on a full-time-equivalent basis, which cleanly reflects half-time and part-time positions. Anyone who simply counts heads (two half-time equals two heads) distorts the number in firms with a high share of part-time staff.
Which KPIs usefully complement revenue per employee?
The most useful additions are the cancellation rate, portfolio-servicing efficiency (policies per case handler), the personnel-cost ratio (personnel ÷ revenue) and the EBIT margin. Revenue per employee is the leading indicator; the others are confirmation or reaction KPIs.
What do salaried brokers earn in Germany?
The average is around 65,000 euros gross annual salary, within a range of 47,000 to 83,000 euros depending on region, specialisation and years in the profession. In-house insurance case handlers sit at around 40,000 euros, with top figures around 52,000 euros.
How does automation affect revenue per employee in the short term?
In the first three to six months, often neutral or slightly negative, because onboarding costs time. From month 6 to 12, measurable effects appear, provided the automation actually creates structured cases rather than just shortening individual tasks. Anyone who sees no effect after 12 months has the wrong tool or the wrong implementation.
Is outsourcing worthwhile for increasing revenue per employee?
Numerically, outsourcing raises the figure, because external service providers don't count as FTE. Strategically it's a weak strategy: you shift complexity outward without improving the operational structure of your own firm. In an exit, buyers often assess a high outsourcing share negatively.
Is 25 percent staff turnover high?
Yes. The industry average is between 12 and 15 percent. Each change costs, experience shows, 30,000 to 50,000 euros through onboarding, knowledge loss and transition phases. Turnover above 20 percent is usually a signal of structural problems: overload, a lack of clarity about responsibilities, or no discernible career path.
See Modus in live operation
The biggest lever on revenue per employee sits before a case handler's first click. It's where emails, WhatsApp messages and documents are still sorted, categorised and translated into cases by hand. Modus takes over exactly this layer. Incoming communication automatically becomes structured cases with an owner, priority and traceability. Your broker management program stays what it is.
A 30-minute demo shows you what that looks like concretely in a brokerage of your size.
Book a demo